11.1 Nine Basic Rules
An incorrectly set up experiment cannot be saved, not even by the most advanced statistical software programs. You need to think before you start an experiment and use the basic rules of DoE to avoid problems. These experiments are so easy, the calculations and analyses will be effortless. You just need to be sure the results contain the answers to your questions.6
To illustrate how to set up an experiment, let’s use the example known as “The hunt for the Red Tomato”.
Sam is an amateur gardener, who is a keen tomato grower.
His local supplier just told him about a great new fertilizer called Red Tomato that is 20% more expensive than Sam’s current Tomato Lover but is guaranteed to give him a lot more tomatoes by the end of the season. The offer is tempting, but Sam wisely decides to test the product before changing over his entire crop. He knows a few things about experimentation and plans to follow nine basic rules of DoE.

Rule One
Define the problem, remembering one aspect of problem definition is quantification. If you want to compare results, you’ll need to know on what basis the results will be compared, so you’ll need to quantify the results. In this case, Sam wants to know, does Red Tomato fertilizer increase my tomato harvest by at least 20% in weight?
Rule Two
It’s not beneficial to solve one problem or improve one aspect and, at the same time, create three new problems or deteriorate several other characteristics. Sam would not be happy if, as a result of changing fertilizer, he had 20% more tomatoes, but they all tasted bad.
Besides evaluating the taste, he might also look at the size of the tomatoes, their size distribution or their color. Although he would not perform the experiment to improve these characteristics, he would need to ensure they stay at an acceptable level, so he would measure and evaluate them at the end of the experiment.
Rule Three
Be aware of the importance of the variation introduced by the measurement system and keep it to a minimum. Weighing systems are generally pretty good, but if Sam wants to be sure, he should analyze his measurement system to ensure it’s adequate. If you want to detect small differences, your sample sizes will increase drastically. Considering information from previous year, Sam decides to treat six plants with tomato lover and six plants with red tomato. This should put him on the safe side when drawing his conclusions.
Rule Four
Before starting a test, you must determine the appropriate sample size because you will use the sample result to draw conclusions for the behavior of the population.
Rule Five
Figure (left) gives you an idea of Sam’s garden and the location he has reserved for his tomato plants. One thing is immediately obvious: Some of the plants will receive a lot more sunshine than others. Now suppose Sam treats six plants in the shade with tomato lover and six plants in the sun with red tomato, and at the end of the season he sees the red tomato plants clearly yield more tomatoes. What has he proven now? That the fertilizer is superior or that tomato plants in the sun yield more tomatoes? No one knows, because the effects of the two factors have been mixed.
Sam marked 12 test spots — six in the shady area and six in the sunny area. Now he has to select which three plants in each area he will treat with Red Tomato.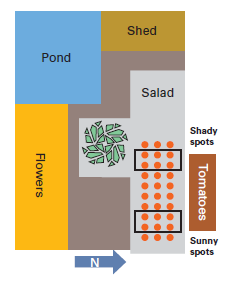
Rule Six
Gardens are mysterious places. They hold all sorts of differences we are not aware of, including small changes in soil composition, the effect of the wind and groundwater levels. All these factors may or may not influence the result of Sam’s test. The only way he can defend himself against these enemies is to set up his experiment so these factors are distributed randomly, by chance, over the experiment.
Sam takes three black and three red playing cards, shuffles them and, at each test location within the block, has his daughter pick one card. If it is a black card, he will treat the plant with Tomato Lover; if it is a red card, he will treat the plant with Red Tomato.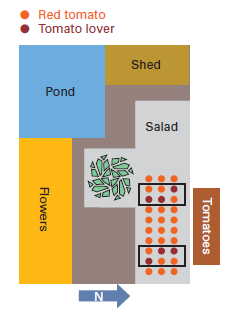
Rule Seven
Sam will not have too many problems following this rule because he’s doing everything himself and will have full control of what will occur during testing. The only thing he may want to do is instruct his daughter not to touch anything in the tomato garden and not to become overenthusiastic and start watering some of the plants.
Rule Eight
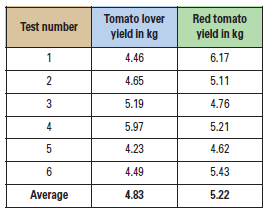
Statistically, you’ll use a t-test to test the null hypothesis that the difference between the means is 0.95 kg vs. the alternative that the difference is larger than 0.95 kg. If you use the assumption of unknown but equal variances, you’ll find \(t_0 = -1.63\), with \(10\) degrees of freedom.
The critical value at the \(0.05\) level is \(1.812\). The only way you could say with 95% confidence that the new fertilizer gives more than a 20% increase in yield would be if the calculated t-statistic were \(> 1.812\). This is clearly not the case. In fact, that data do not show a statistically significant difference in mean at all.
If the result were positive, Sam would still have to analyze all the other characteristics to see if minimum requirements were fulfilled.
Rule Nine
Those who understand statistics will see from a t-test there is not a significant difference between the two fertilizers. However, not all people involved in the experiment will be knowledgeable in statistics. That’s why graphical presentation of results is important in communicating the results of the test.
Figures below show there is definitely not a 20% higher tomato harvest with Red Tomato fertilizer. It is also illustrated there is a lot of overlap on the individual test results, indicating the observed difference in mean could be due to chance and has no great significance. In most cases, the graphical representation will tell the whole story.
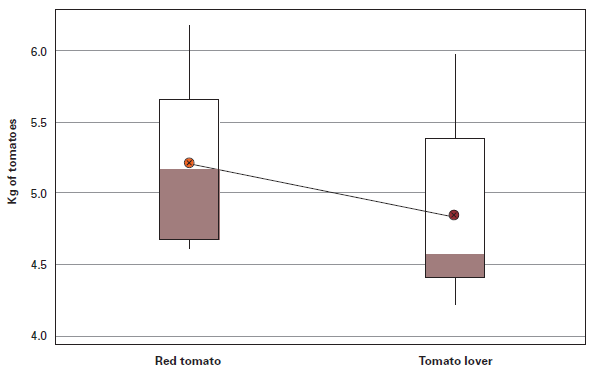 Box Plot of Tomato Yield Per Fertilizer
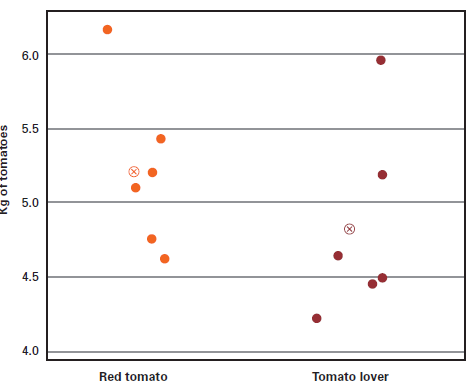 Individual Value Plot of Tomato Yield Per Fertilizer