14.1 One-Sample: Hypothesis Testing on a Proportion
Hypothesis testing for a proportion is used to determine if a sampled proportion is significantly different from a specified population proportion. For example, if you expect the proportion of male births to be 50 percent, but the actual proportion of male births is 53 percent in a sample of 1000 births. Is this significantly different from the hypothesized population parameter?12
We will consider testing:
\[H_0: p=p_0\]
\[H_1: p \neq p_0\]
Let \(x\) be the number of observations in a random sample of size \(n\) that belongs to the class associated with \(p\).
If \(H_0: p=p_0\) is true, the quantity
\[ Z=\dfrac{x-np_0}{\sqrt{np_0(1-p_0)}}\] has approximately a standard normal distribution, \(N(0,1)\)
An equivalent expression is:
\[\begin{equation} Z=\dfrac{\hat{p}-p_0}{\sqrt{p_0(1-p_0) \left( \dfrac{1}{n} \right)}} \end{equation}\]
14.1.1 The Hypotheses and \(p\)-value
The null hypothesis is our statement of no effect. In this case our null hypothesis is that population proportion is equals to a value. We can write this as \(H_0: p = p_0\).
The alternative hypothesis is one of three possibilities, depending upon the specifics of what we are testing for:
- \(H_1\): \(p\) is greater than \(p_0\).
- This is a one-tailed or one-sided test.
- \(p\)-value is the proportion of the normal distribution that is greater than \(Z\).
- \(H_1\): \(p\) is less than \(p_0\).
- This is also one-sided test.
- \(p\)-value is the proportion of the normal distribution that is less than \(Z\).
- \(H_1\): \(p\) is not equal to \(p_0\).
- This is a two-tailed or two-sided test.
- \(p\)-value is the the proportion of the normal distribution that is greater than \(|Z|\), the absolute value of \(Z\).
14.1.2 Decision rule
Now we make a decision on whether to reject the null hypothesis (and thereby accept the alternative), or to fail to reject the null hypothesis. We make this decision by comparing our p-value to the level of significance \(\alpha\).
If the \(p\)-value is less than or equal to \(\alpha\), then we reject the null hypothesis. This means that we have a statistically significant result and that we are going to accept the alternative hypothesis.
If the \(p\)-value is greater than \(\alpha\), then we fail to reject the null hypothesis. This does not prove that the null hypothesis is true. Instead it means that we did not obtain convincing enough evidence to reject the null hypothesis.
14.1.3 Example 01
The CEO of a large electric utility claims that 80 percent of his 1,000,000 customers are very satisfied with the service they receive. To test this claim, the local newspaper surveyed 100 customers, using simple random sampling. Among the sampled customers, 73 percent say they are very satisfied. Based on these findings, can we reject the CEO’s hypothesis that 80% of the customers are very satisfied? Use a 0.05 level of significance
From here.
Data
\[ n=100, \,\,\, \hat{p}=0.73, \,\,\, p_0=0.80 \]
Hypothesis
\[ H_0: p= 0.80 \] \[ H_1: p \neq 0.80 \]
t-stat
\[ Z=\dfrac{0.73-0.80}{\sqrt{0.80(1-0.80) \left( \dfrac{1}{100} \right)}} = -1.75\]
p-value
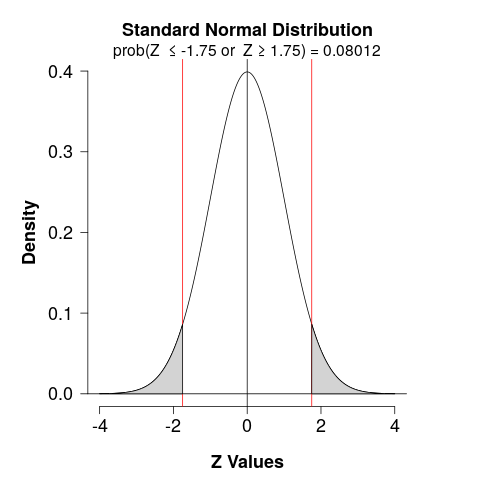
- The \(p\)-value is the probability of being less or greater than 1.75, which is \(P(z < -1.75) = 0.04\), and \(P(z > 1.75) = 0.04\).
- Thus, the \(p\)-value \(= 0.04 + 0.04 = 0.08012\).
- Since the \(p\)-value is greater than \(0.05\), we don’t have quite enough evidence to reject \(H_0\).
Conclusion
Since the \(p\)-value (\(0.08\)) is greater than the significance level (\(0.05\)), we cannot reject the null hypothesis.
Suppose the previous example is stated a little bit differently. Suppose the CEO claims that at least 80 percent of the company’s 1,000,000 customers are very satisfied. Again, 100 customers are surveyed using simple random sampling. The result: 73 percent are very satisfied. Based on these results, should we accept or reject the CEO’s hypothesis? Assume a significance level of \(0.05\).
14.1.4 Example 02
A bank will open a new branch in a particular neighborhood if it can be reasonably sure that at least 10% of the residents will consider banking at the new branch.
The bank will use a significance level of \(0.05\) to make its decision. The bank does a survey of residents of a particular neighborhood and finds that \(19\) out of \(100\) random people surveyed said they’d consider banking at the new branch. Run a test and determine whether the bank should open the new branch, considering its standard policy.
From here
Data
\[ n=100, \,\,\, \hat{p}=0.19, \,\,\, p_0=0.10 \]
Hypothesis
\[ H_0: p \leq 0.10 \] \[ H_1: p > 0.10 \]
t-stat
\[ Z=\dfrac{0.19-0.10}{\sqrt{0.10(1-0.10) \left( \dfrac{1}{100} \right)}} = 3\]
p-value
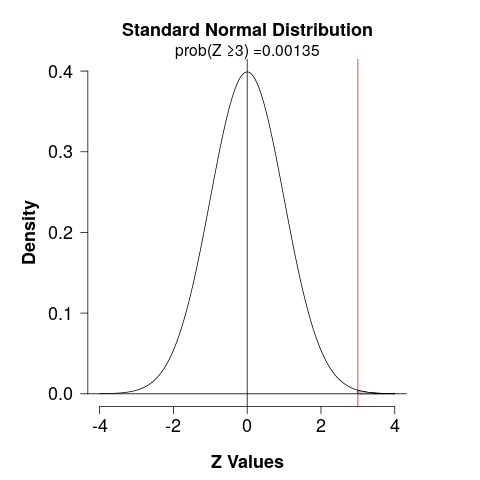
- The \(p\)-value is the probability of being higher than \(3\), which is \(P(z > 3) = 1 – 0.9987 = 0.0013\).
- Thus, the \(p\)-value is much lower than \(0.05\), we have evidence to reject \(H_0\).
Conclusion
The bank wanted to use a significance level of \(0.05\), so \(\alpha = 0.05\), and the \(p\)-value of \(0.0013\) is much lower than that. So we reject the null hypothesis and state that we have empirical evidence that more than 10% of the residents will consider banking at the new branch.That is, the bank should open the new office at that neighborhood.
14.1.5 Example 03
A corporate call center hopes to resolve \(75\%\) or more of customer calls through an automated computer voice recognition system. It randomly surveys \(50\) recent customers; \(45\) report that their issue was resolved.
Can the management of the corporation conclude that the computer system is hitting its minimum target, using a significance level of \(0.05\)?
From here
Data
\[ n=50, \,\,\, \hat{p}=\frac{45}{50}=0.90, \,\,\, p_0=0.75 \]
Hypothesis
\[ H_0: p \leq 0.75 \] \[ H_1: p > 0.75 \]
t-stat
\[ Z=\dfrac{0.90-0.75}{\sqrt{0.75(1-0.75) \left( \dfrac{1}{50} \right)}} = 2.4495\]
p-value
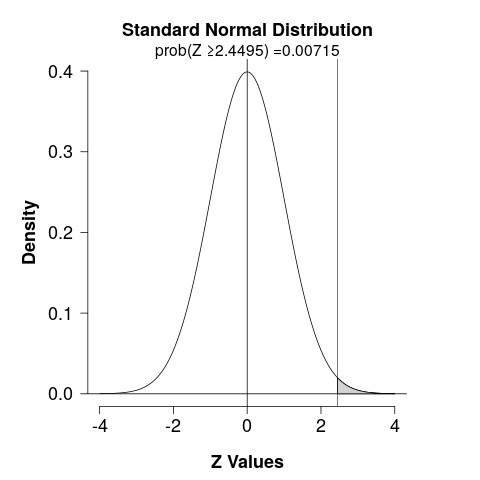
- The \(p\)-value is the probability of being higher than \(2.4495\), which is \(P(z > 2.4495) = 0.00715\).
- Thus, the \(p\)-value is less than \(0.05\), we have evidence to reject \(H_0\).
Conclusion
Since we have evidence to reject \(H_0\), we conclude that the the computer system is hitting its minimum target.