8.3 Price by OS
Mobile Phones Prices
Is the mean price of the iPhone higher than the price of other smartphones?
8.3.1 Data
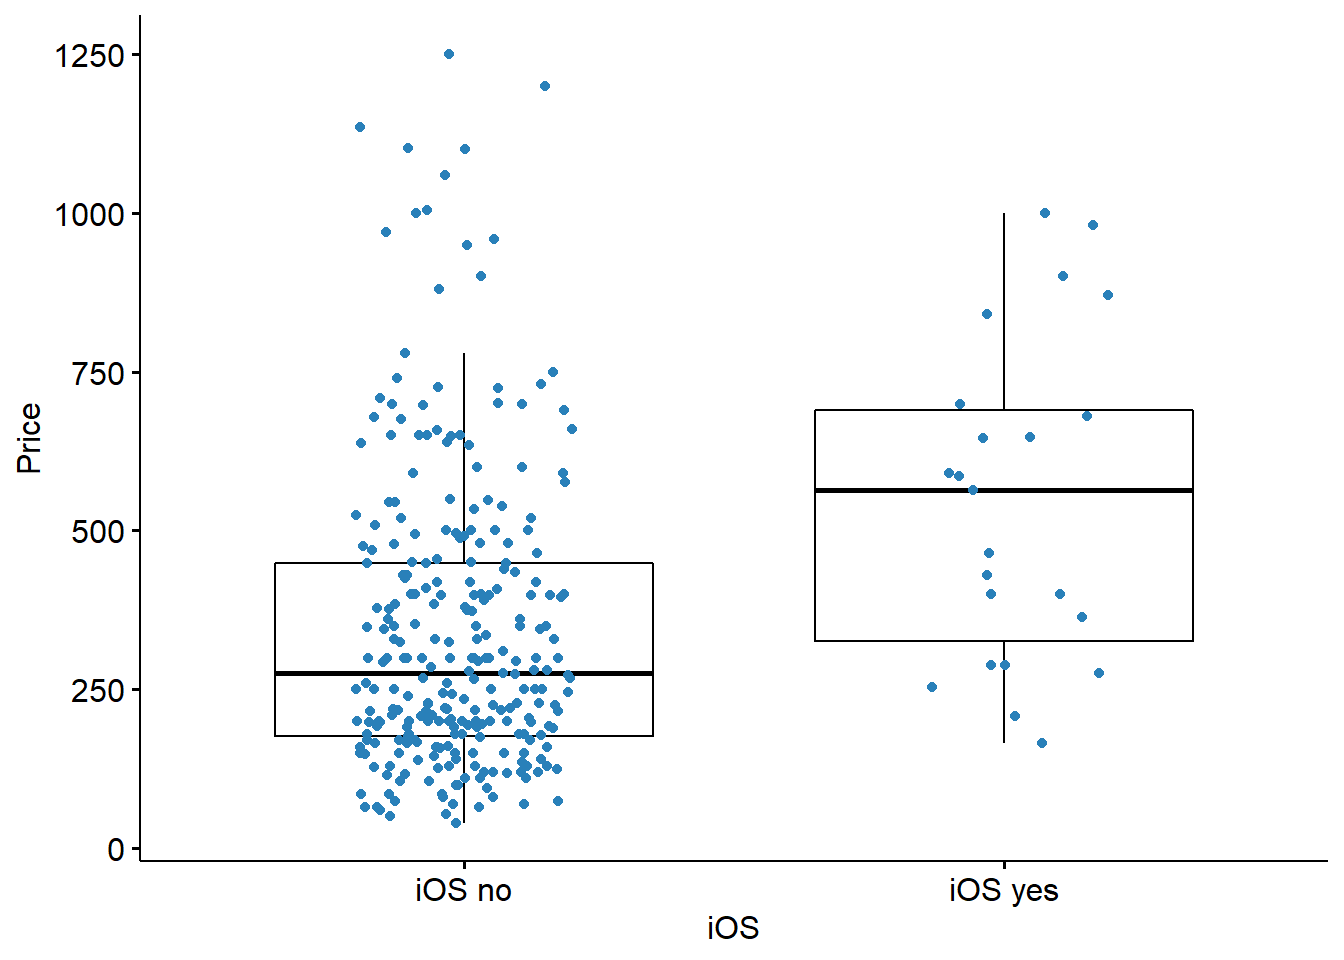
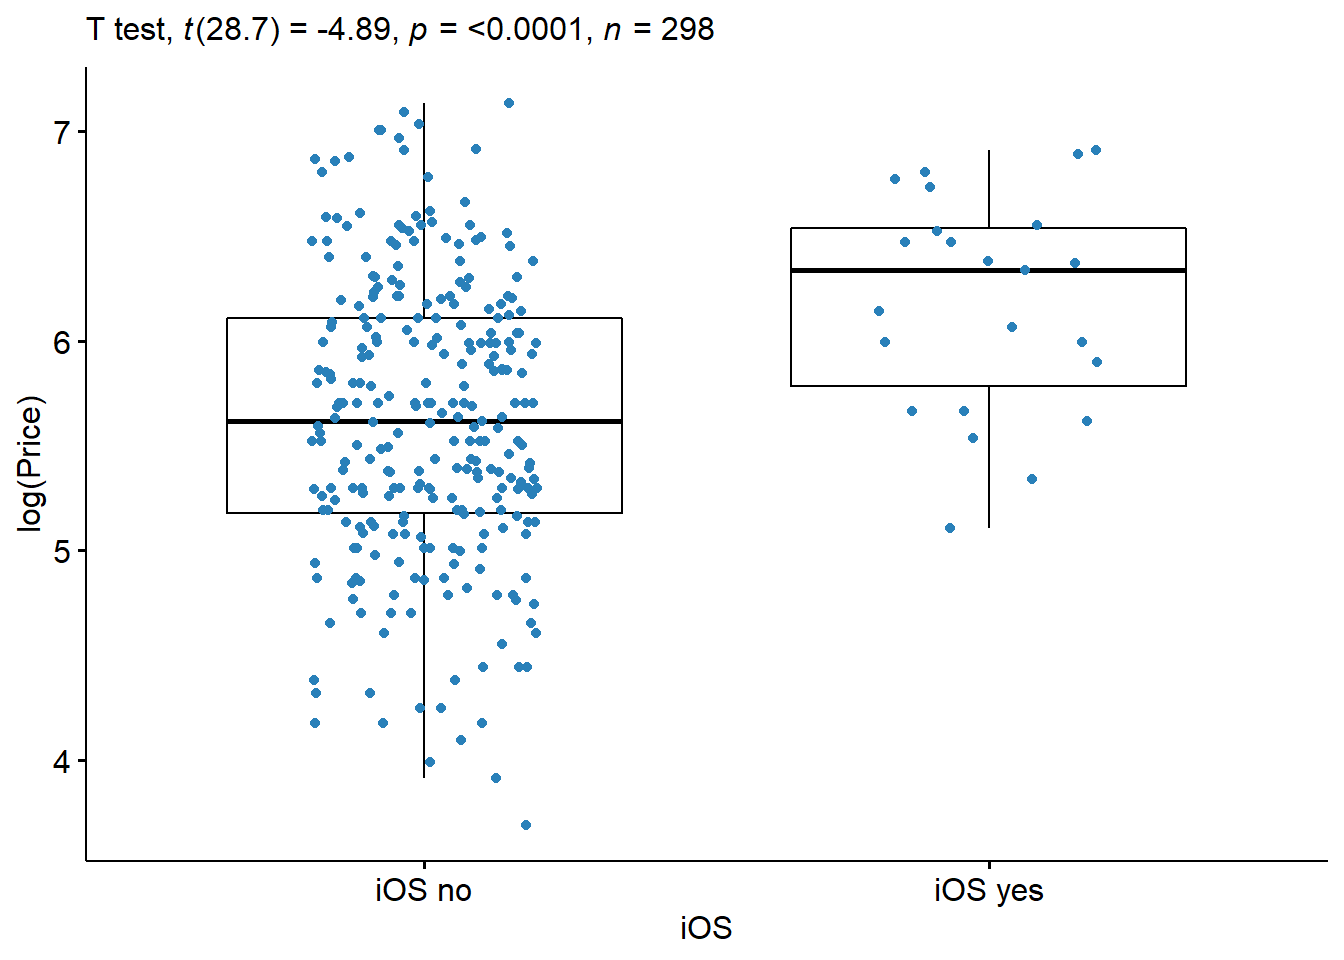
The chart below boxplot shows the prices of the devices, grouped by Operating System. We see that the bulk of iOS devices tend to be the most expensive.
8.3.2 Research question
Although we already know that iOS devices, in general, are more expensive, we will use the available data to confirm (or not) this prior belief.
- The independent samples t-test will help us to compare the mean of the two groups.
- We can assume that devices corresponds to two unrelated/independent groups.
- The question to answer is: Is the mean price of the iPhone is statistically different from other smartphones?
8.3.3 Preparing Data
First, let’s group the mobiles in two classes: iOS and others.
- Create two groups of devices: 0 = is iOS and 1=is not iOS
- This operation is called Recoding variables
- Remember that there are missing values (NA’s)
The sample has \(23\) prices of iPhones and \(275\) of others. The mean price of iPhone is \(202\) dollars more expensive than the smartphones with other OS. In the chart below each point corresponds to a data point in the sample, the large dispersion of prices can be observed.
| count | mean | sd |
|---|---|---|
| 298 | 358.74 | 241.7 |
The next step is to evaluate is the difference in the mean price is statistically significant.
- Statistical significance is the likelihood that a relationship between two or more variables is caused by something other than chance.
- Statistical significance is used to provide evidence concerning the plausibility of the null hypothesis, which hypothesizes that there is nothing more than random chance at work in the data.
- Statistical hypothesis testing is used to determine whether the result of a data set is statistically significant.
From here
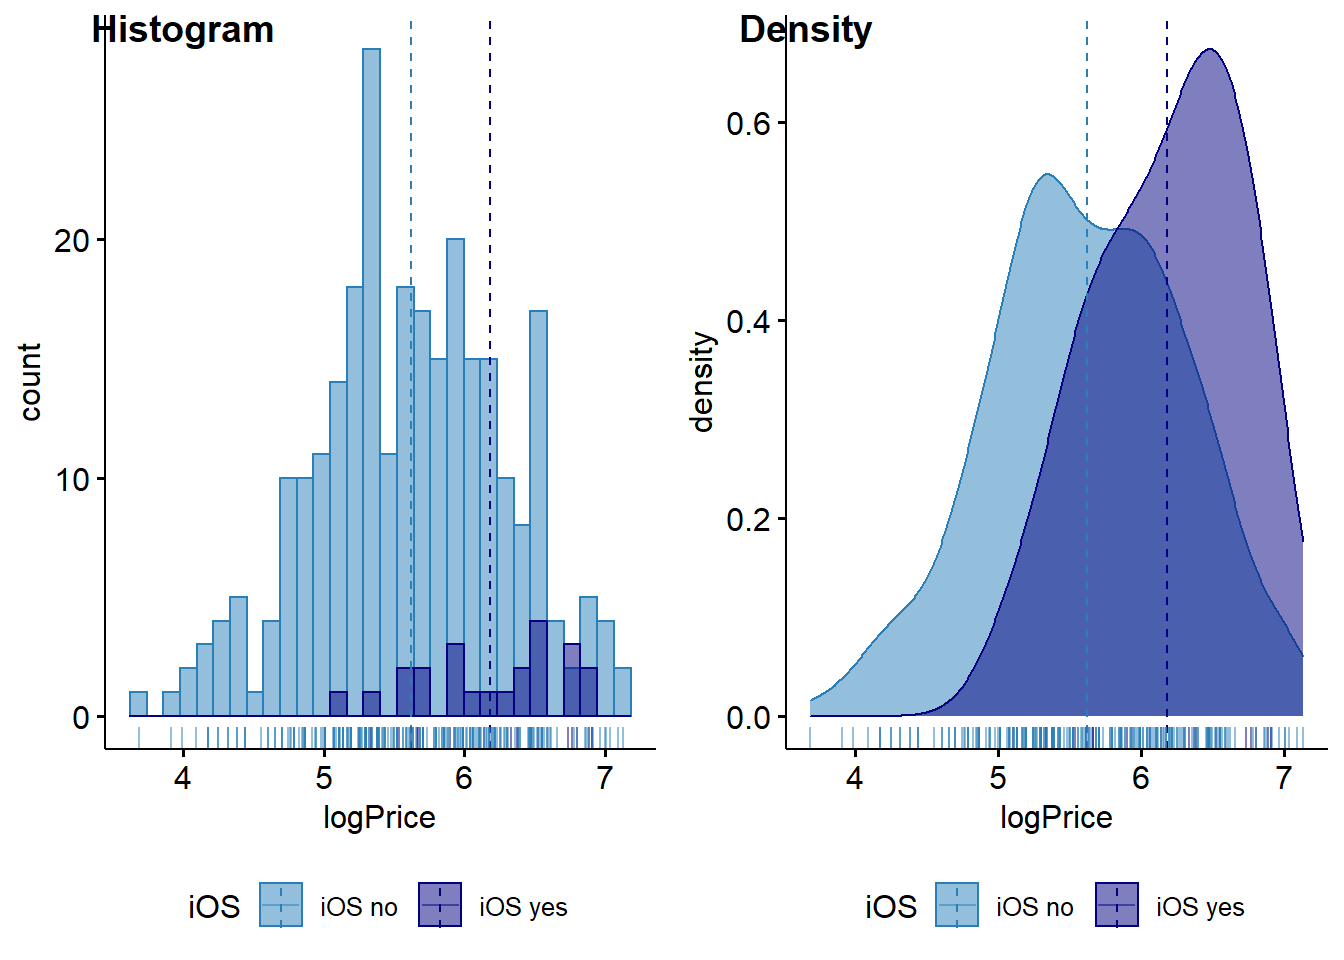
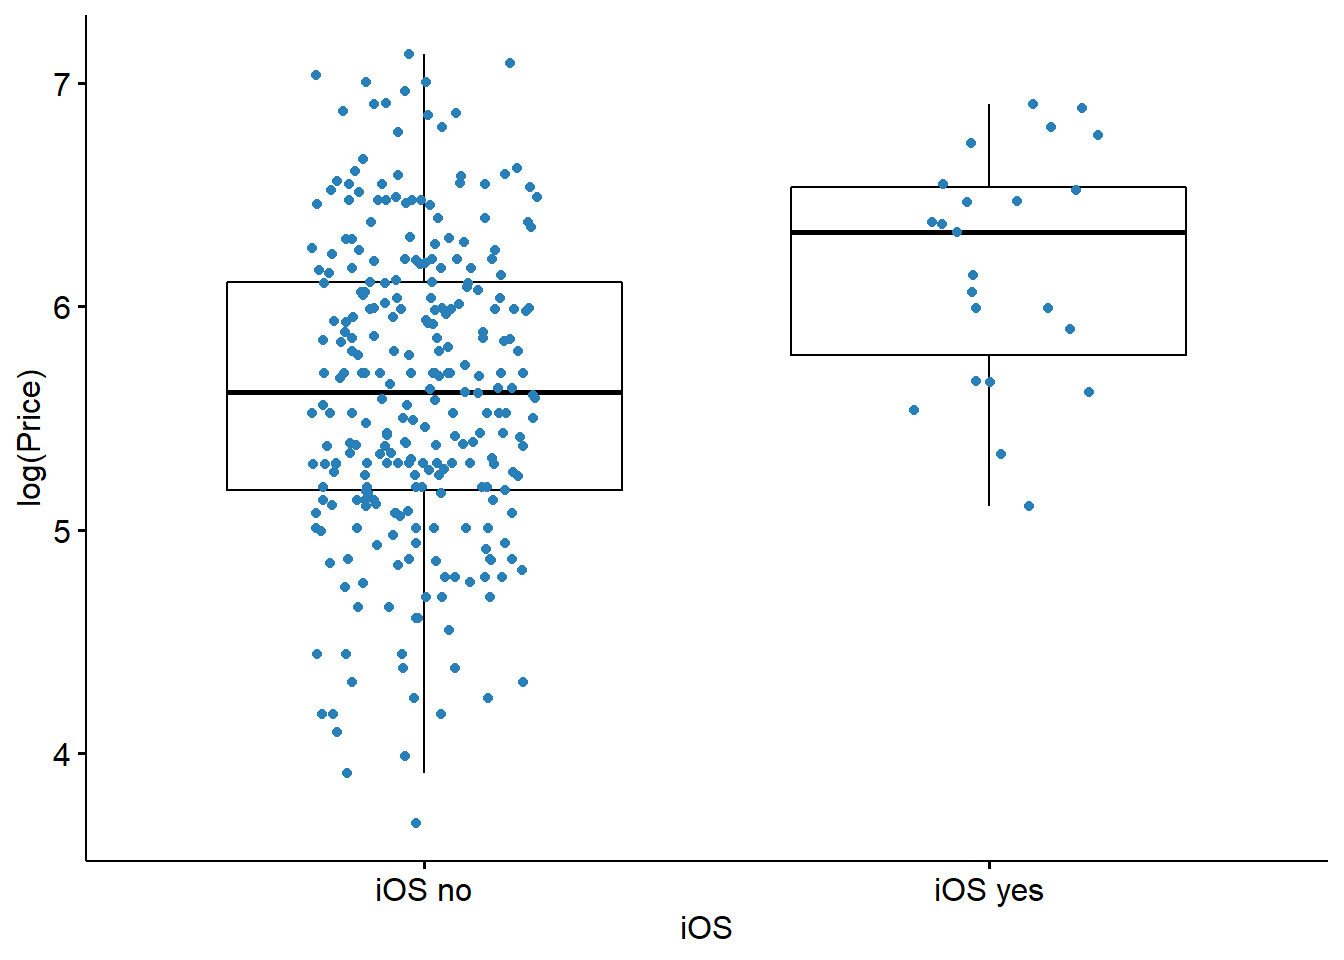
To continue with the hypothesis test we need to apply a log transformation to the Price. It will produce a normal distributed variable. The new variable is represented below.
| count | mean | sd |
|---|---|---|
| 298 | 5.66 | 0.68 |
- Log transformation is a data transformation method in which it replaces each variable \(x\) with a \(log(x)\). In Excel: \(=ln(x)\)
- When our original continuous data do not follow the bell curve, we can log transform this data to make it as “normal” as possible so that the statistical analysis results from this data become more valid. In other words, the log transformation reduces or removes the skewness of our original data. The important caveat here is that the original data has to follow or approximately follow a log-normal distribution. Otherwise, the log transformation won’t work.
-
Remember \(log(A) - log(B) \neq log(A-B)\)
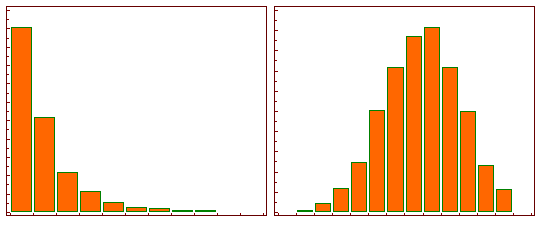
The Effect of Log Transformation. From here
8.3.4 Mean Comparison
We want to know whether the mean prices are different between groups. The t-test compares the mean and standard deviation of two samples. The necessary calculations for the test and t-test itself are:
| .y. | group1 | group2 | n1 | n2 | statistic | df | p | p.signif |
|---|---|---|---|---|---|---|---|---|
| logPrice | iOS no | iOS yes | 275 | 23 | -4.888005 | 28.70252 | 3.55e-05 | **** |
The mean price in iOS group was 545.09 (sd = 254.29), whereas the mean in Other OS group was 343.16 (sd = 234.47). At the level of significance, there is sufficient evidence to conclude that the mean price is different (higher) for iOS smartphones.
The 7 Step Process of Statistical Hypothesis Testing
- Step 1: State the Null Hypothesis \(H_0\)
- Step 2: State the Alternative Hypothesis \(H_1\)
- Step 3: Set \(\alpha\)
- Step 4: Collect Data
- Step 5: Calculate a test statistic
- Step 6: Construct Acceptance / Rejection regions
- Step 7: Based on steps 5 and 6, draw a conclusion about \(H_0\)
A complete output of the t-test can be:
.
.   Welch Two Sample t-test
.
. data:  logPrice by iOS
. t = -4.888, df = 28.703, p-value = 3.549e-05
. alternative hypothesis: true difference in means is not equal to 0
. 95 percent confidence interval:
.  -0.7994137 -0.3276271
. sample estimates:
.  mean in group iOS no mean in group iOS yes
.              5.619591              6.183112
An alternative to present the results is:
The mean price in iOS group was 545.09 (sd = 254.29), whereas the mean in Other OS group was 343.16 (sd = 234.47). A two-samples t-test showed that the difference was statistically significant, t(28.7) = -4.888, p < 0.0001; where, t(26.9) is shorthand notation for a Welch t-statistic that has 26.9 degrees of freedom.
8.3.5 More on data visualization