16.3 Regression Basics
Source: Janice H. Hammond (2010). Quantitative Methods Online Course: Regression Section from Harvard Business Publishing Education.
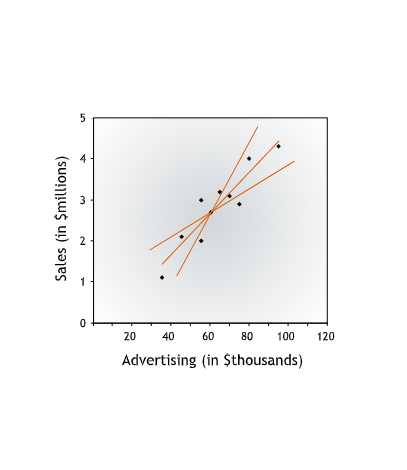
several lines could describe the relationship
- In the example, the best-fit line is Sales = -333,831 + 50*Advertising. For this line, the y-intercept is -333,831 and the slope is 50.
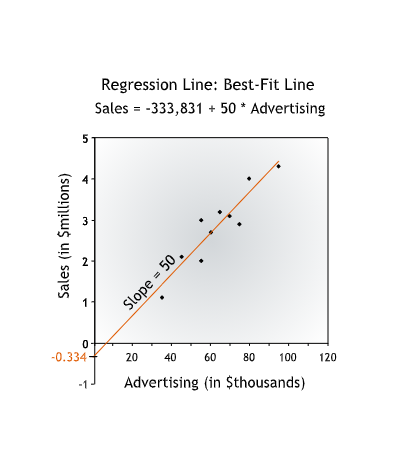
The constant term -333,831 may have no real managerial significance; it just “anchors” the regression line by telling us the \(y\)-intercept. We’ve never seen advertising levels close to 0 dollars, so we cannot infer that spending no money on advertising will lead to sales of -333,831 dollars!
The more important term is the advertising coefficient, 50, which gives us the slope of the line. The advertising coefficient tells us how sales have changed on average as advertising has increased.
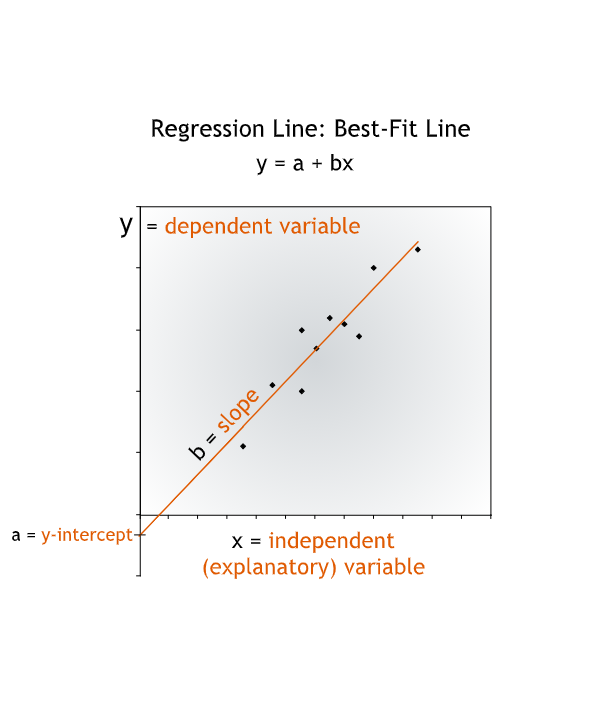
In this equation, the y-variable, sales, is called the dependent variable, to suggest that we think Julius’ sales depend to some degree on his advertising. The x-variable, advertising, is called the independent variable, or the explanatory variable.
- Having identified the relationship between the two variables from the full data set, we can apply our understanding of that relationship to our forecast.
Another critical caveat to keep in mind is that whenever we use historical data to predict future values, we are assuming that the past is a reasonable predictor of the future. Thus, we should only use regression to predict the future if the general circumstances that held in the past, such as competition, industry dynamics, and economic environment, are expected to hold in the future.