16.1 Straigh Line Relationship
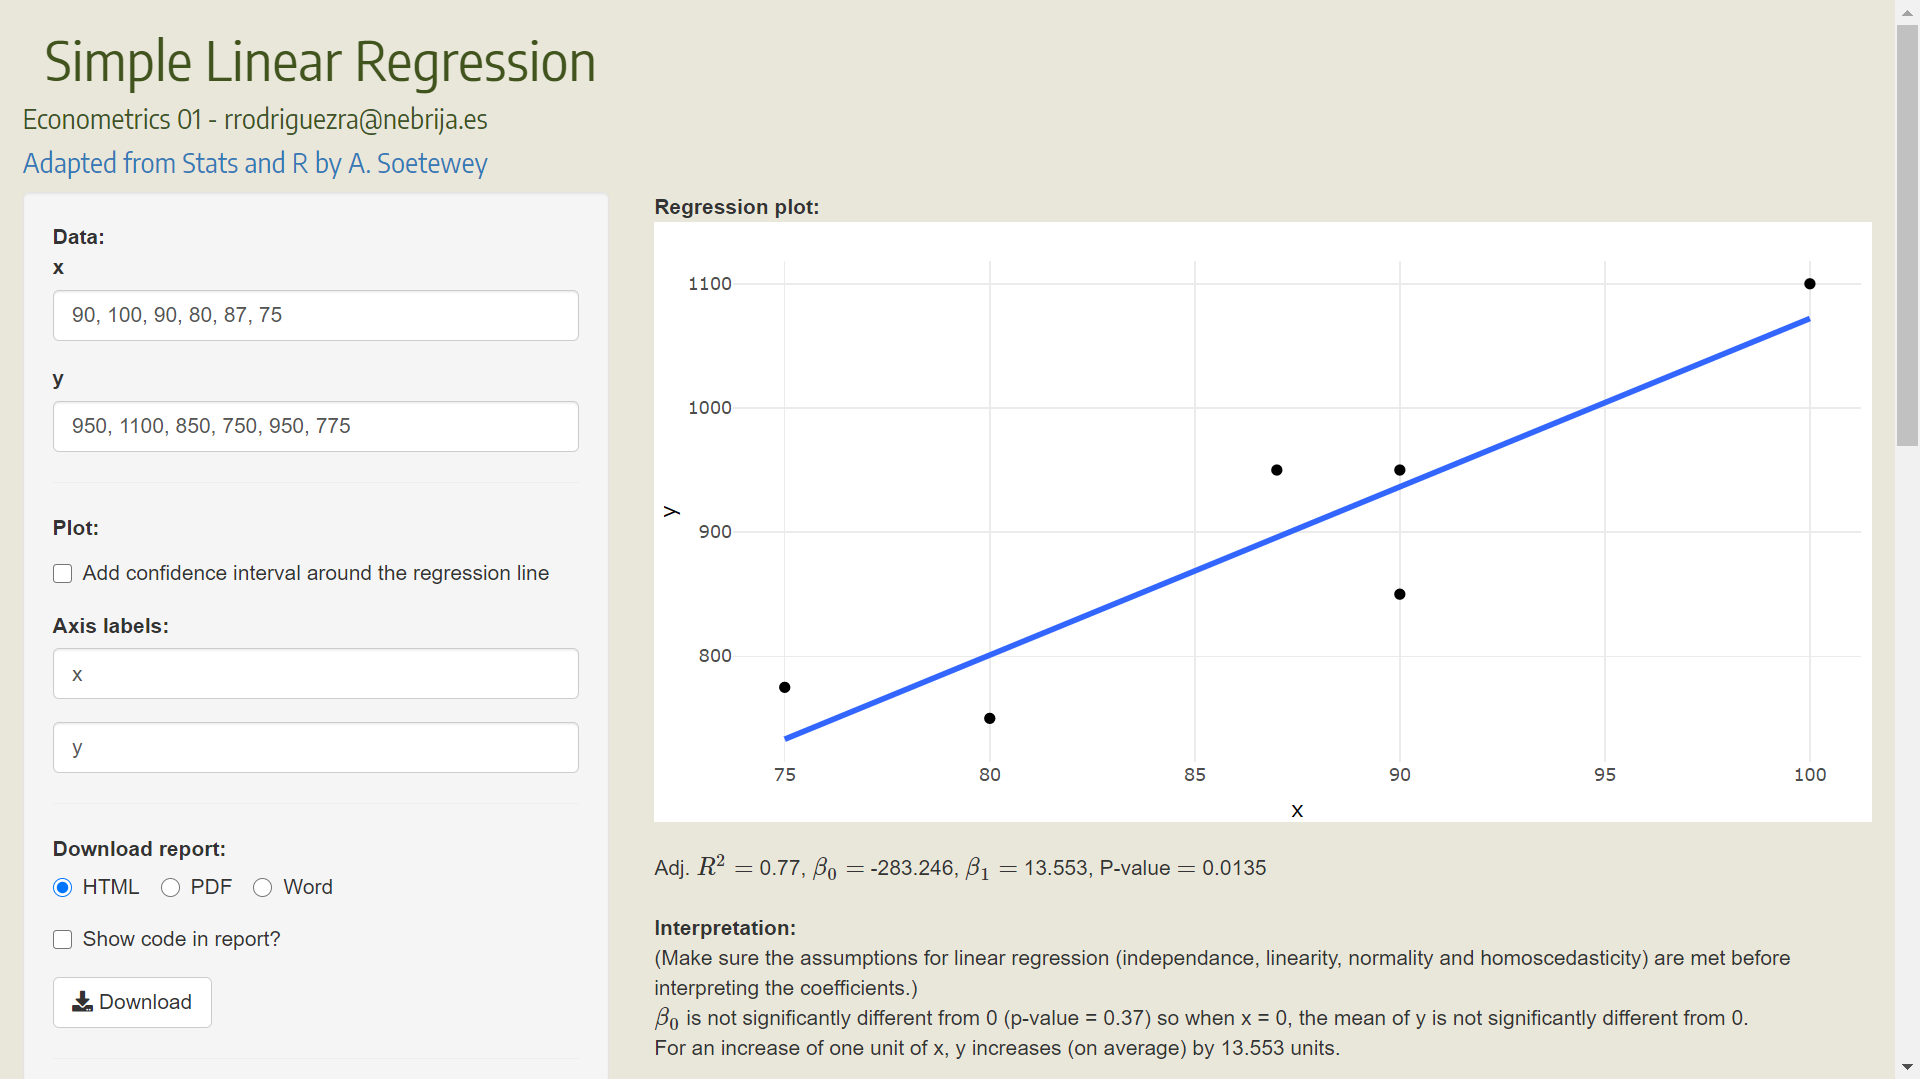
Let’s use this app Simple Linear Regression to understand what a straight line relationship between two variables is.
Output = Response variable = Dependent Variable = \(Y\)
Input = Predictor variable = Regressor = Explanatory = Independent Variable = \(X\)
Response variable = Model function + Random error
\[Y = f(X) +\epsilon\]
\[\begin{equation}
Y = \beta_0 + \beta_1 X + \epsilon
\end{equation}\]
\[\begin{equation}
y_i = \beta_0 + \beta_1 x_i + \epsilon_i
\end{equation}\]
The simple linear regression model is:
\[\begin{equation} y_i = \mu_i + \epsilon_i = \beta_0 + \beta_1 x_i + \epsilon_i \end{equation}\]
Here,
- \(\mu_i = \beta_0 + \beta_1 x_i\) is the mean value of the dependent variable when the value of the independent variable \(X\) is \(x_i\)
- \(\epsilon_i\) is an error term that describes the effects on \(y_i\) of all factors other than the value \(x_i\) of the independent variable \(X\)
- \(\beta_0\) (the \(y\)-intercept) is the mean value of the dependent variable when the value of the independent variable \(X\) is zero.
- \(\beta_1\) (the slope) is the change in the mean value of the dependent variable.
- If \(\beta_1\) is positive, the mean value of the dependent variable increases as the value of the independent variable increases. See Figure @ref(sales-adv-regression).
- If \(\beta_1\) is negative, the mean value of the dependent variable decreases as the value of the independent variable increases.See Figure @ref(fuel-temperature-regression).