C.3 The t-table
The t-table (for the t-distribution) is different from the Z-table (for the Z-distribution)
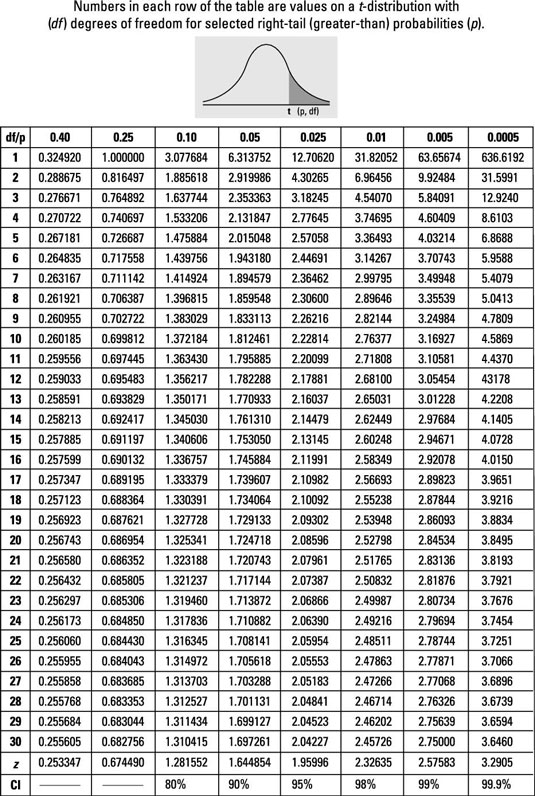
In the t-table (on the right) numbers in each row are values on a \(t\)-distribution with df for selected right-tail probabilities.
Finding probabilities for various t-distributions, using the t-table, is a valuable statistics skill.